Local structure analysis of Re/Fe2O3 catalysts by high energy XAFS


Inquiry number
SOL-0000001205
Beamline
BL01B1 (XAFS I)
Scientific keywords
| A. Sample category | inorganic material |
|---|---|
| B. Sample category (detail) | amorphous, glass |
| C. Technique | absorption and its secondary process |
| D. Technique (detail) | XAFS, EXAFS, XANES |
| E. Particular condition | polarization (linear), low-T (~ liquid He) |
| F. Photon energy | X-ray (> 40 keV) |
| G. Target information | chemical state, chemical bonding, local structure, function and structure, function |
Industrial keywords
| level 1---Application area | display, environment, Chemical product, others |
|---|---|
| level 2---Target | catalysis, Environmental material |
| level 3---Target (detail) | |
| level 4---Obtainable information | local structure, chemical state |
| level 5---Technique | XAFS, NEXAFS |
Classification
A80.34 catalysis, M40.10 XAFS
Body text
In this solution, EXAFS method was applied to study local environments of Re(9.2 wt%)/Fe2O3, catalysts for methanol partial oxidation reaction to produce methylal. The EXAFS method is a powerful technique to study local structure (distance, coordination number, species of neighbor atoms) of selected elements both in crystalline states and in non-crystalline states. For this sample, Re L3-edge EXAFS is difficult to measure due to large absorption by Fe2O3 support. High quality EXAFS spectrum could be measured at high energy Re K-edge (Fig. 1). EXAFS analysis revealed that Re and Fe atoms form a Re-Fe binary oxide and stabilize an active ReO4 structure (Fig. 2).
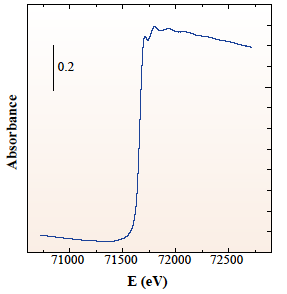
Fig. 1 Re K-edge EXAFS spectrum of Re(9.2 wt%)/Fe2O3.
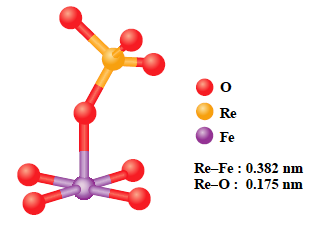
Fig. 2 Proposed structure of Re active site on Re/Fe2O3.
Source of the figure
Bulletin from SPring-8
Bulletin title
SPring-8 Research Frontiers, 2000-2001
Page
53,54
Technique
XAFS spectra of dense samples are taken in a transmission mode. This method is performed by measuring x-ray absorption as a function of x-ray energy around an absorption edge of a selected element. Since EXAFS oscillation is smeared in high-energy region, XAFS spectra at more than 50 keV are usually measured at low temperature (10 K) to get high quality data by lowering temperature factor. Acquisition time per XAFS spectrum using QXAFS mode is 30-45 min in this solution.
Source of the figure
No figure
Required time for experimental setup
2 hour(s)
Instruments
| Instrument | Purpose | Performance |
|---|---|---|
| XAFS Measurement System | Measurement of XAFS spectra | 3.8-113 keV |
| Ionization Chamber | Measurement of transmission mode XAFS | concentration > 1000 ppm |
References
| Document name |
|---|
| T. Shido et al., SPring-8 Reserch Frontiers, 2000-2001, (2001) 53 |
Related experimental techniques
Questionnaire
The measurement was possible only in SPring-8. Impossible or very difficult in other facilities.
This solution is an application of a main instrument of the beamline.
Ease of measurement
Easy
Ease of analysis
Middle
How many shifts were needed for taking whole data in the figure?
Less than one shift